Analysis 6A — onset timing during stimulus omission

Macaque multi-area laminar electrophysiology · Exploratory analysis not publication-final

Static publication figures

Vector SVG, generated by the frozen figure script from the same canonical tables that drive the interactive pages. These are the citable versions.
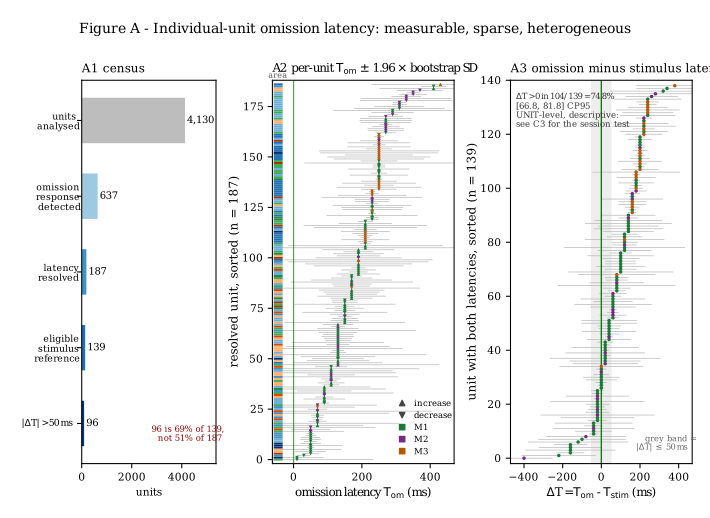
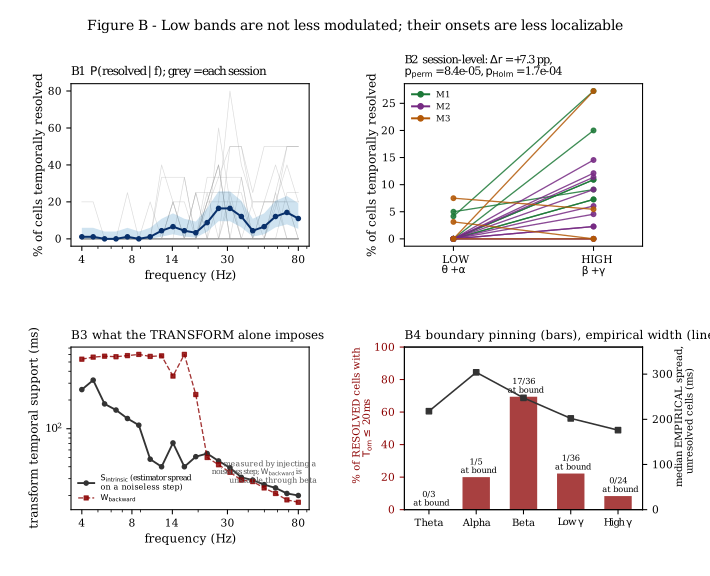
Figure A — SPK timing
Figure A — SPK timing. Census funnel, per-unit resolved latency with bootstrap intervals, and ΔT = Tom − Tstim.
Figure B — LFP temporal resolution
Figure B — LFP temporal resolution. Fraction temporally resolved by frequency, low-vs-high session pairing, transform temporal resolution, and censoring / estimator spread.
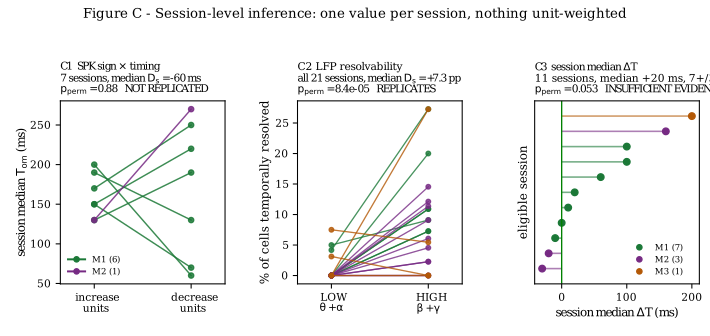
Figure C — session-level inference
Figure C — session-level inference. The three session-level tests, run with the same procedure, with their three different outcomes.
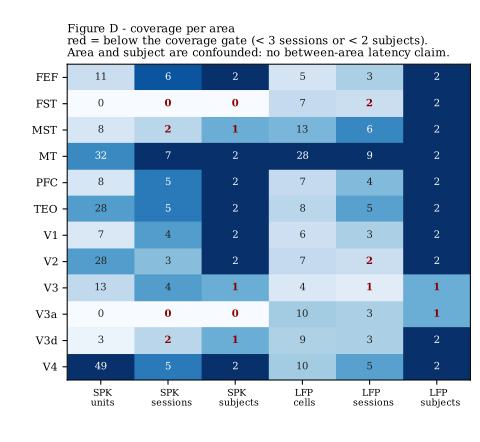
Figure D — coverage and design
Figure D — coverage and design. Subject × session × area coverage, making the area/subject confound visible.

Figure E does not exist. A common-axis SPK-vs-LFP comparison is held pending separate authorization. The LFP side would need an interval-and-censoring representation, and producing it merely because a website can display it would invert the order of evidence.